Building The India Portfolio #11 – Portfolio Comparison and Deal Timelines
The Portfolio Comparison feature is designed to help you benchmark a fund's sectoral preferences directly against its peer group. Coupled with our new Timeline view, you can now easily track a fund's true portfolio expansion velocity over time.
At its core, this feature helps you answer crucial strategic questions: “Is this fund following the herd or making contrarian bets? And how fast are they actually deploying capital into new assets?”
You are able to go beyond high-level marketing pitches and see exactly where the capital is flowing compared to the wider market.
Analyzing Strategy & Velocity
Most databases provide a flat list of investments and sectors. But to truly understand a fund's thesis, you need context and comparison:
Portfolio vs Peers: We automatically pit a fund's sectoral composition against its peer group (funds that invest in similar stages and ticket sizes). This highlights sector concentration, variations against market norms, and uncovers contrarian investment styles.
Investment Timelines: We map out a yearly timeline (the current year plus the 3 previous calendar years) showing the pure count of new companies added to the portfolio. By filtering out follow-ons and exits, this gives you a clear indicator of a fund's true deal velocity and highlights any sectoral hype cycles.
Understanding Through Illustration
Let's look at a real-world example using Creador.
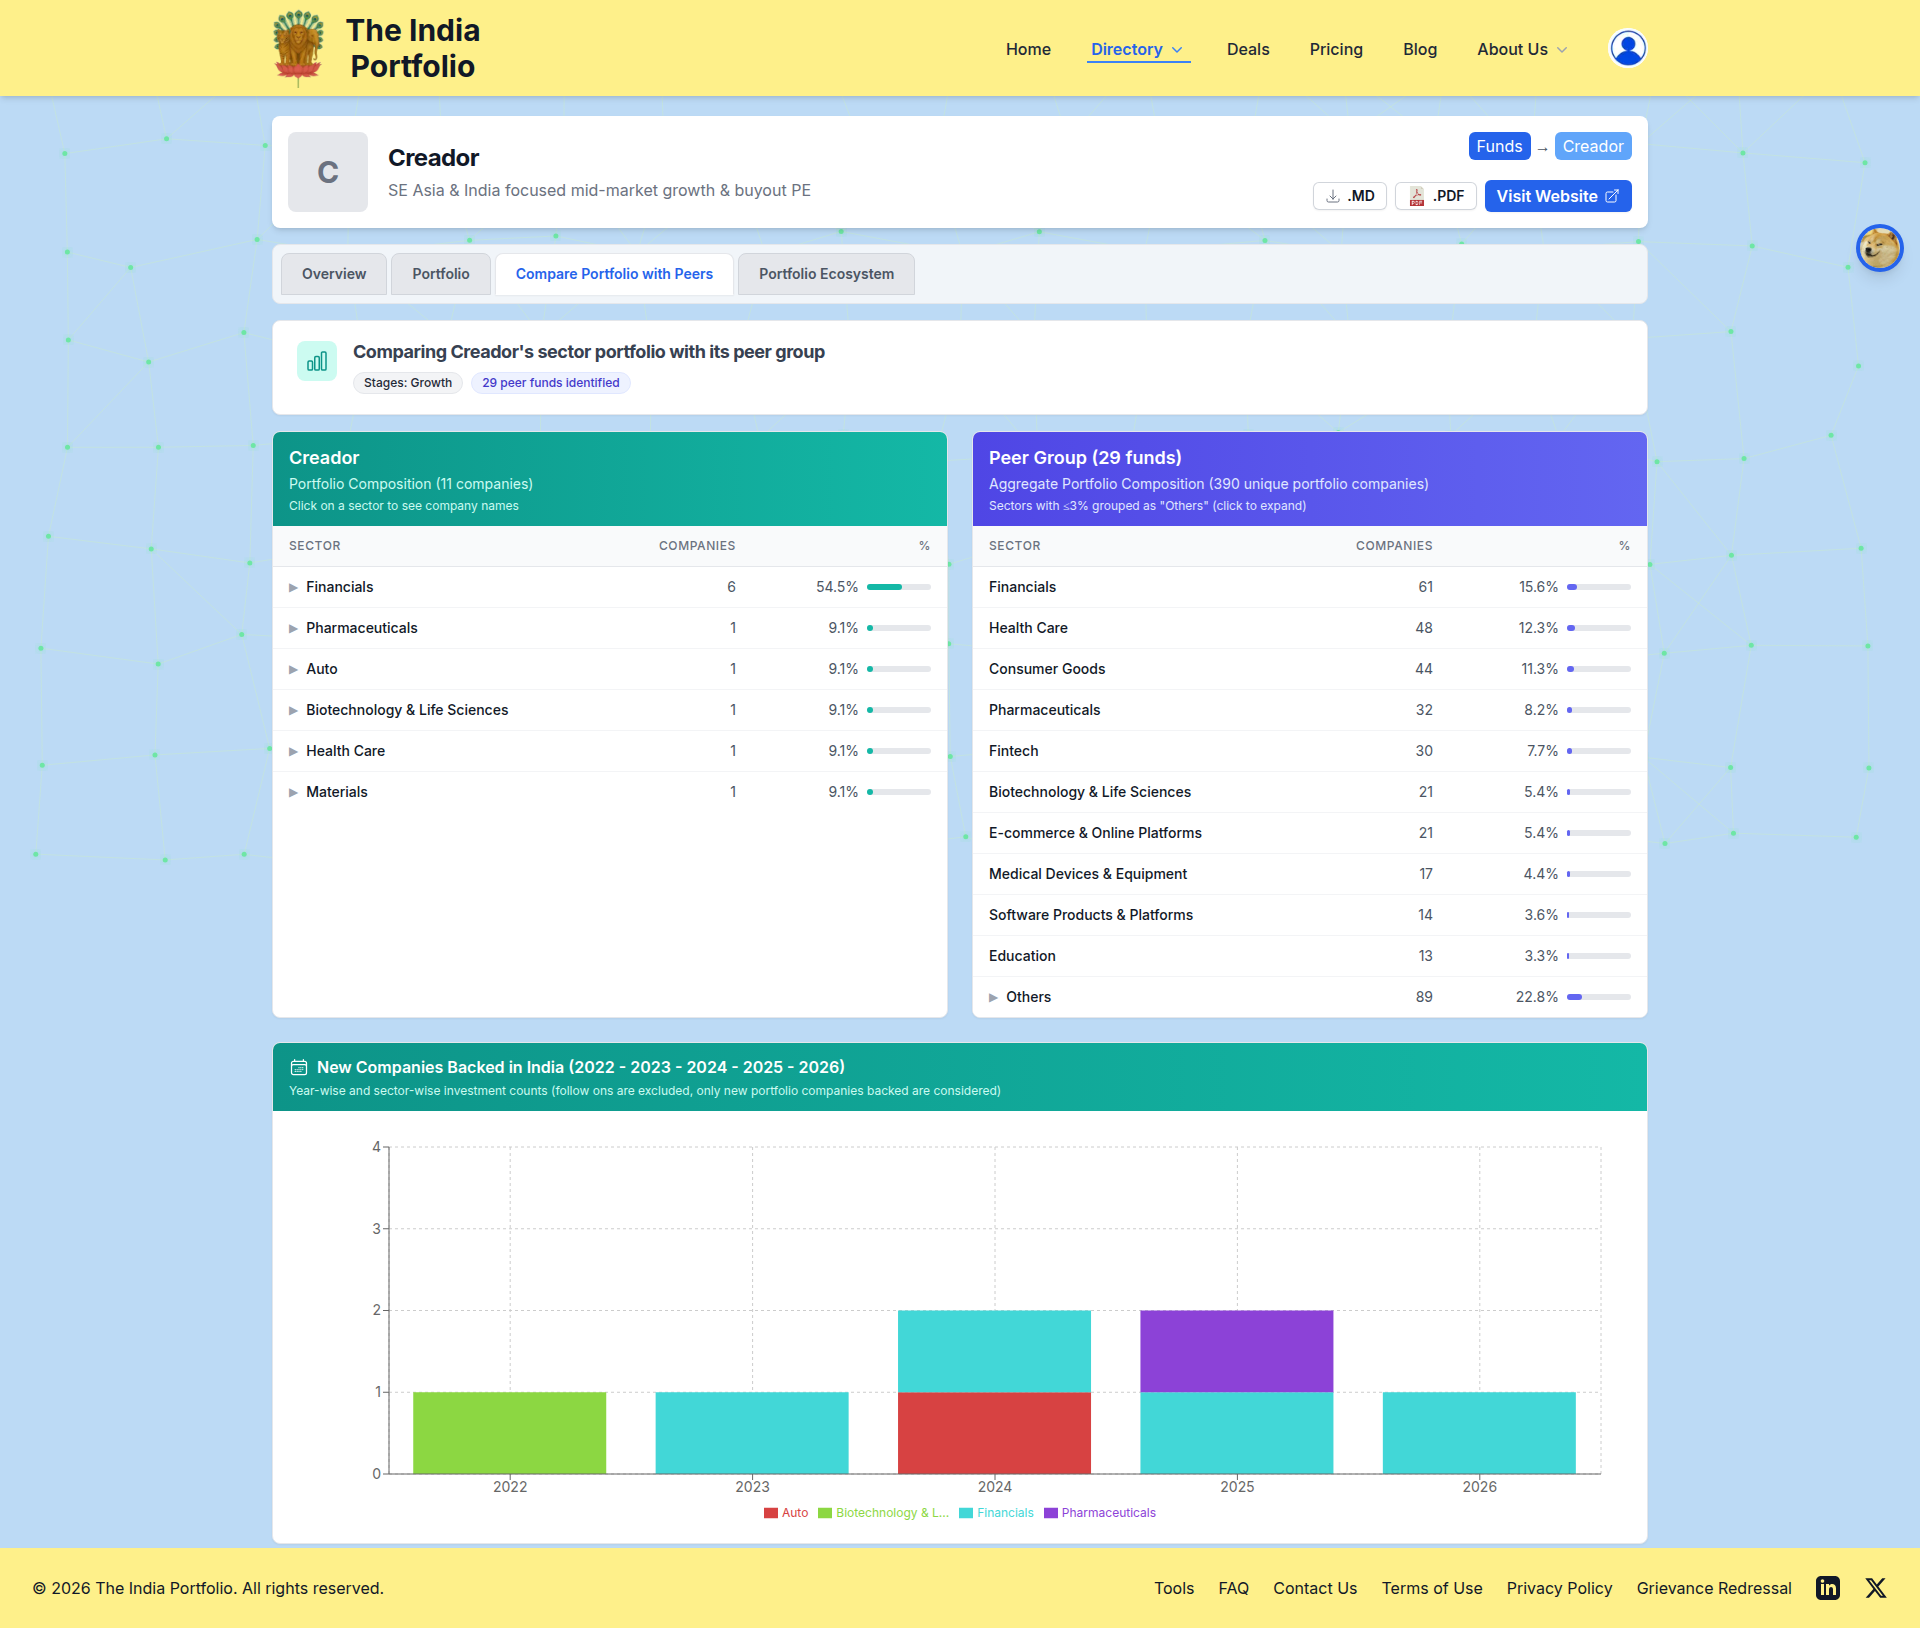
As you can see, Creador has 11 portfolio companies (as of Mar 2026), spread across 6 sectors. Their concentration is pronounced, with 6 of those 11 portfolio companies belonging to the Financials sector (revealing a special affinity for NBFCs!).
Now consider the sectoral spread of Creador's peer funds - essentially other Growth stage Private Equity funds. The peer funds also have Financials as their top sector. While comparing direct percentage values can be tricky (since a wider peerset naturally appears less concentrated), tracking the commonality in the top-N sectors is highly revealing. In the case of Creador, 4 out of its 6 chosen sectors (Financials, Pharmaceuticals, Biotechnology & Life Sciences, and Health Care) also show up in the top-10 invested sectors of the peerset. You can safely say that Creador's strategy is broadly in line with its peers - nothing contrarian here.
Moving to Creador's Timeline, they have invested into 7 new companies over CY2022 to the first three months of CY2026 (3mCY2026), adding a steady 1 to 2 new portfolio companies every year. Notice the consistent sector activity: they have maintained their focus on Financials, backing 1 new company in this sector every year of the timeline barring CY2022. This timeline feature is also perfect for pointing out sectoral deal frenzies (which, notably, we don't see in Creador's deal activity).
Points to Note & Limitations
New Investments Only: The timeline feature exclusively counts investments into new portfolio companies. It does not factor in follow-on rounds into existing portfolio companies or exits.
Data Integrity: We source this data from fund websites and public news. While we try to ensure the highest accuracy and comprehensiveness of portfolio data, any limitations or inaccuracies in the underlying public sources might flow through into our data.
The Deal-Making Platform for the AI Era
The India Portfolio is constantly upgrading itself. We are regularly thinking through and putting together the pieces of the data and deals layers to build out India's finest deal making platform.
Sign In today and start using the Directory that is meant for Deal making.
The India Portfolio
Data For Deals
Do Your Own Deals